Parallel Processing
Course Schedule
Resource Presentations
Case Study Presentations - Let’s pick a winner!
Next Week’s Case Study
Introduction to Parallel Processing
Serial Computing
Most (legacy) software is written for serial computation:
- Problem broken into discrete set of instructions
- Instructions executed sequentially on a single processor
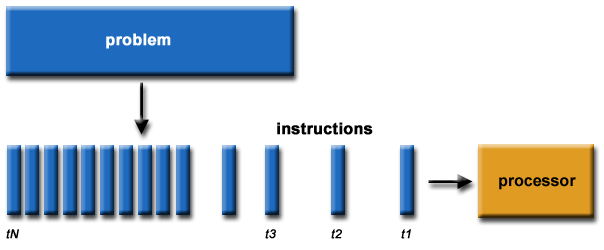
Figure from here
Parallel computation
- Problem divided into discrete parts that can be solved concurrently
- Instructions executed simultaneously on different processors
- Overall control/coordination mechanism
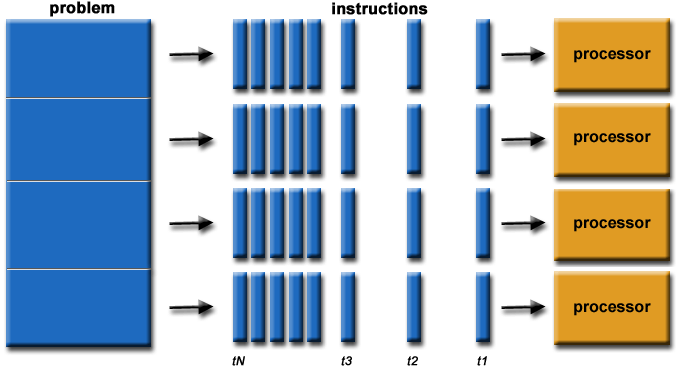
Figure from here
Flynn’s taxonomy
A classification of computer architectures (Flynn, 1972)
Four Categories
- Single Instruction, Single Data (SISD)
- No parallelization
- Single Instruction, Multiple Data (SIMD)
- Run the same code/analysis on different datasets
- Examples:
- different species in species distribution model
- same species under different climates
- Multiple Instruction, Single Data (MISD)
- Run different code/analyses on the same data
- Examples:
- One species, multiple models
- Multiple Instruction, Multiple Data streams (MIMD)
- Run different code/analyses on different data
- Examples:
- Different species & different models
Flynn’s Taxonomy
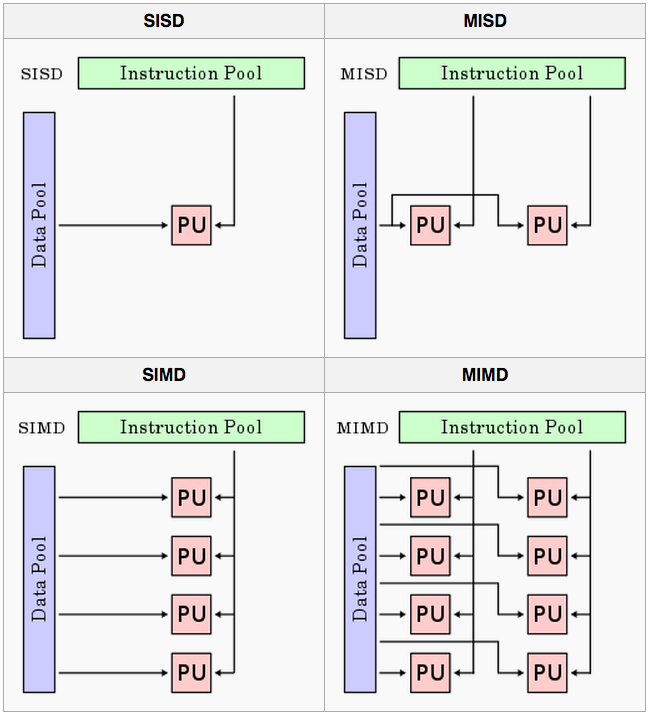
Figure from here
Our focus: Single Instruction, Multiple Data (SIMD)
- Parallel functions within an R script
- starts on single processor
- runs looped elements on multiple ‘slave’ processors
- returns results of all iterations to the original instance
- foreach, multicore, plyr, raster
- Alternative: run many separate instances of R in parallel with
Rscript- need another operation to combine the results
- preferable for long, complex jobs
- NOT planning to discuss in this session
R Packages
There are many R packages for parallelization, check out the CRAN Task View on High-Performance and Parallel Computing for an overview. For example:
- Rmpi: Built on MPI (Message Passing Interface), a de facto standard in parallel computing.
- snow: Simple Network of Workstations can use several standards (PVM, MPI, NWS)
- parallel Built in R package (since v2.14.0).
- multidplyr
ForEach Package
The foreach package has numerous advantages including:
- intuitive
for()loop-like syntax - flexibility of parallel ‘backends’ from laptops to supercomputers
(
multicore,parallel,snow,Rmpi, etc.) - nice options for combining output from parallelized jobs
Documentation for foreach:
Foreach backends
- doParallel
best for use on multicore machines (uses
forkon linux/mac andsnowon windows). - doMPI: Interface to MPI (Message-Passing Interface)
- doSNOW: Simple Network of Workstations
Examples
Libraries
Sequential for loops
With for()
Sequential for loops
## [1] 1 4 9With foreach()
## [[1]]
## [1] 1
##
## [[2]]
## [1] 4
##
## [[3]]
## [1] 9
x is a list with one element for each iterator variable
(i). You can also specify a function to use to combine the
outputs with .combine. Let’s concatenate the results into a
vector with c.
Sequential foreach() loop with
.combine
## [1] 1 4 9Tells foreach() to first calculate each iteration, then
.combine them with a c(...)
Sequential foreach() loop with
.combine
##          [,1]
## result.1    1
## result.2    4
## result.3    9
Another example
x <- seq(-8, 8, by=0.2)
v <- foreach(y=x, .combine="cbind") %do% {
    r <- sqrt(x^2 + y^2)
    sin(r) / r
}
persp(x, x, v)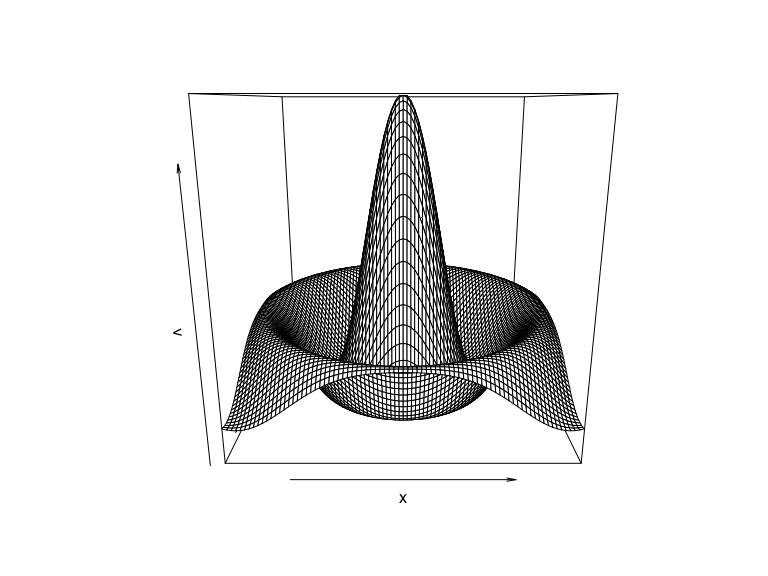
Parallel foreach() loop
So far we’ve used %do% which uses a single
processor.
Must register a parallel backend with one of the
do* functions. On most multicore systems, the easiest
backend is typically doParallel(). On linux and mac, it
uses fork system call and on Windows machines it uses
snow backend. The nice thing is it chooses automatically
for the system.
registerDoParallel(3) # register specified number of workers
#registerDoParallel() # or, reserve all all available cores
getDoParWorkers() # check registered cores
## [1] 3Parallel foreach() loop
To run in parallel, simply change the %do% to
%dopar%. Wasn’t that easy?
## [1] 1 4 9Test the relative speed
## 0.002 sec elapsed## 0.011 sec elapsedTest the relative speed
## 9.019 sec elapsed## 3.018 sec elapsedAnother example
# Example task: Simulate a large number of random normal distributions and calculate their means
num_simulations <- 1000
sample_size <- 1e6  # Size of each random sample

# sequential foreach loop
tic()
results <- foreach(i = 1:num_simulations, .combine = 'c') %do% {
  # Generate a random sample and calculate the mean
  sample_data <- rnorm(sample_size, mean = 0, sd = 1)
  mean(sample_data)
}
toc()
## 31.091 sec elapsed# Parallel foreach loop
tic()
results <- foreach(i = 1:num_simulations, .combine = 'c') %dopar% {
# Generate a random sample and calculate the mean
sample_data <- rnorm(sample_size, mean = 0, sd = 1)
mean(sample_data)
}
toc()## 10.672 sec elapsedNested foreach loops
Example from the foreach vignette
avec = 1:3
bvec = 1:4
sim <- function(a, b)  # example function
  10 * a + b ^ 2
# use a standard nested for() loop:
x <- matrix(0, length(avec), length(bvec))
for (j in 1:length(bvec)) {
  for (i in 1:length(avec)) {
    x[i, j] <- sim(avec[i], bvec[j])
  }
}
x
## [,1] [,2] [,3] [,4]
## [1,] 11 14 19 26
## [2,] 21 24 29 36
## [3,] 31 34 39 46Nested Foreach
##      result.1 result.2 result.3 result.4
## [1,]       11       14       19       26
## [2,]       21       24       29       36
## [3,]       31       34       39       46
Again, simply change %do% to %dopar% to
execute in parallel.
Alternative backends: doMPI
Message Passing Interface: specification for an API for passing messages between different computers.
See here for details on using MPI on UB’s High Performance Computer Cluster.
Review Basic Steps
Most parallel computing:
- Split problem into pieces (iterators:
i=1:3) - Execute the pieces in parallel (
%dopar%) - Combine the results back (
.combine)
Useful foreach parameters
.inorder(true/false) results combined in the same order that they were submitted?.errorhandling(stop/remove/pass).packagespackages to made available to sub-processes.exportvariables to export to sub-processes
Multidplyr
Multidplyr
# Load necessary libraries
library(multidplyr)
library(dplyr)

# Create a sample data frame
set.seed(42)
data <- tibble(
  group = rep(1:4, each = 100000),
  value = rnorm(400000)
) %>%
  group_by(group)

# Start the cluster with 4 cores
cluster <- new_cluster(4)

# Split the data into groups and assign it to the cluster
cluster_copy(cluster, "data")
Use dplyr to apply an operation in series
Use multidplyr to apply a dplyr operation
in parallel
result2 <- data %>%
  partition(cluster = cluster) %>%   # Partition the data into groups for parallel processing
  mutate(
    mean_value = mean(value),   # Calculate mean of 'value' within each group
    value_squared = value^2     # Square the 'value' column
  ) %>%
  collect()  # Combine the results from each partition

identical(result1,result2)
## [1] TRUETerra Package
Parallel processing with raster
Some functions in the raster package also easy to parallelize.
library(terra)
ncores=2

# Define the function to work with vectors
fn <- function(x) {
  # Apply the calculation for each value in the vector 'x'
  sapply(x, function(xi) mean(rnorm(1000, mean = xi, sd = abs(xi)) > 3))
}


r=rast(nrows=1e3,ncol=1e3) # make an empty raster
values(r)<-rnorm(ncell(r)) #fill it with random numbers## 35.559 sec elapsed## 23.406 sec elapsedSummary
Each task should involve computationally-intensive work. If the tasks are very small, it can take longer to run in parallel.
Parallel computation
- Problem divided into discrete parts that can be solved concurrently
- Instructions executed simultaneously on different processors
- Overall control/coordination mechanism
Figure from here
Flynn’s taxonomy
A classification of computer architectures (Flynn, 1972)
Figure from here