My grandfather says summers are getting hotter
Import data and plot a timeseries
Reading
- The ggplot2 vignette
Background
You are at a family gathering at Niagara Falls and your grandfather claims that summer temperatures are hotter now than they were when he was a kid in the 1920s. His brother disagrees - he remembers summers being just as hot as they are now. Your inner data scientist thinks this is an empirical question that you can answer with data.
You will use the NASA GISS temperature record for the Buffalo Niagara Airport available from this website. Later we’ll learn how to use APIs to interact with online databases, but for now we’ll work with a simple csv file.
Instructions
Download the temperature data
If you explore the NASA GISS website for a station (Buffalo, NY website), you’ll find they provide a link to download the data directly as a comma-separated-values (CSV) file. CSV files are simple text files with commas in between the values. They are a common format for storing and sharing relatively small tabular datasets because they are so simple that many different software can open them, from Excel to ArcGIS.
library(tidyverse)

# define the link to the data - you can try this in your browser too.  Note that the URL ends in .txt.
dataurl="https://data.giss.nasa.gov/tmp/gistemp/STATIONS_v4/tmp_USW00014733_14_0_1/station.csv"
This url points to a CSV file with monthly mean temperatures from the
GISS dataset. You can check
out the file here. Now use read_table() to download and
import the table directly from the website (cool, huh!?).
#the next line tells the NASA site to create the temporary file
httr::GET("https://data.giss.nasa.gov/cgi-bin/gistemp/stdata_show_v4.cgi?id=USW00014733&ds=14&dt=1")
## Response [https://data.giss.nasa.gov/cgi-bin/gistemp/stdata_show_v4.cgi?id=USW00014733&ds=14&dt=1]
## Date: 2024-09-05 16:19
## Status: 200
## Content-Type: text/html
## Size: 51.5 kB
##
## <!DOCTYPE HTML><html lang="en">
##
## <head>
## <meta http-equiv="X-UA-Compatible" content="IE=edge;"/>
## <meta http-equiv="Content-Type" content="text/html;charset=utf-8" />
## <link rel="stylesheet" type="text/css" href="https://www.giss.nasa.gov/css/cs...
## <title>Data.GISS:
## GISS Surface Temperature Analysis (v4)
## </title>
## ...# the next lines download the data
temp=read_csv(dataurl,
na="999.90", # tell R that 999.90 means missing in this dataset
skip=1, # we will use our own column names as below so we'll skip the first row
col_names = c("YEAR","JAN","FEB","MAR", # define column names
"APR","MAY","JUN","JUL",
"AUG","SEP","OCT","NOV",
"DEC","DJF","MAM","JJA",
"SON","metANN"))
# renaming is necessary becuase they used dashes ("-")
# in the column names and R doesn't like that.If the command above gives you an error, open the
page in the browser and update the dataurl link to
download the csv.
Explore the data
Now use your tools to explore the dataset. You can try
View(temp) to open the table in a browsable ‘excel-like’
window. Or summary(temp) to get summaries of each column.
Or glimpse(temp).
Develop the graphic
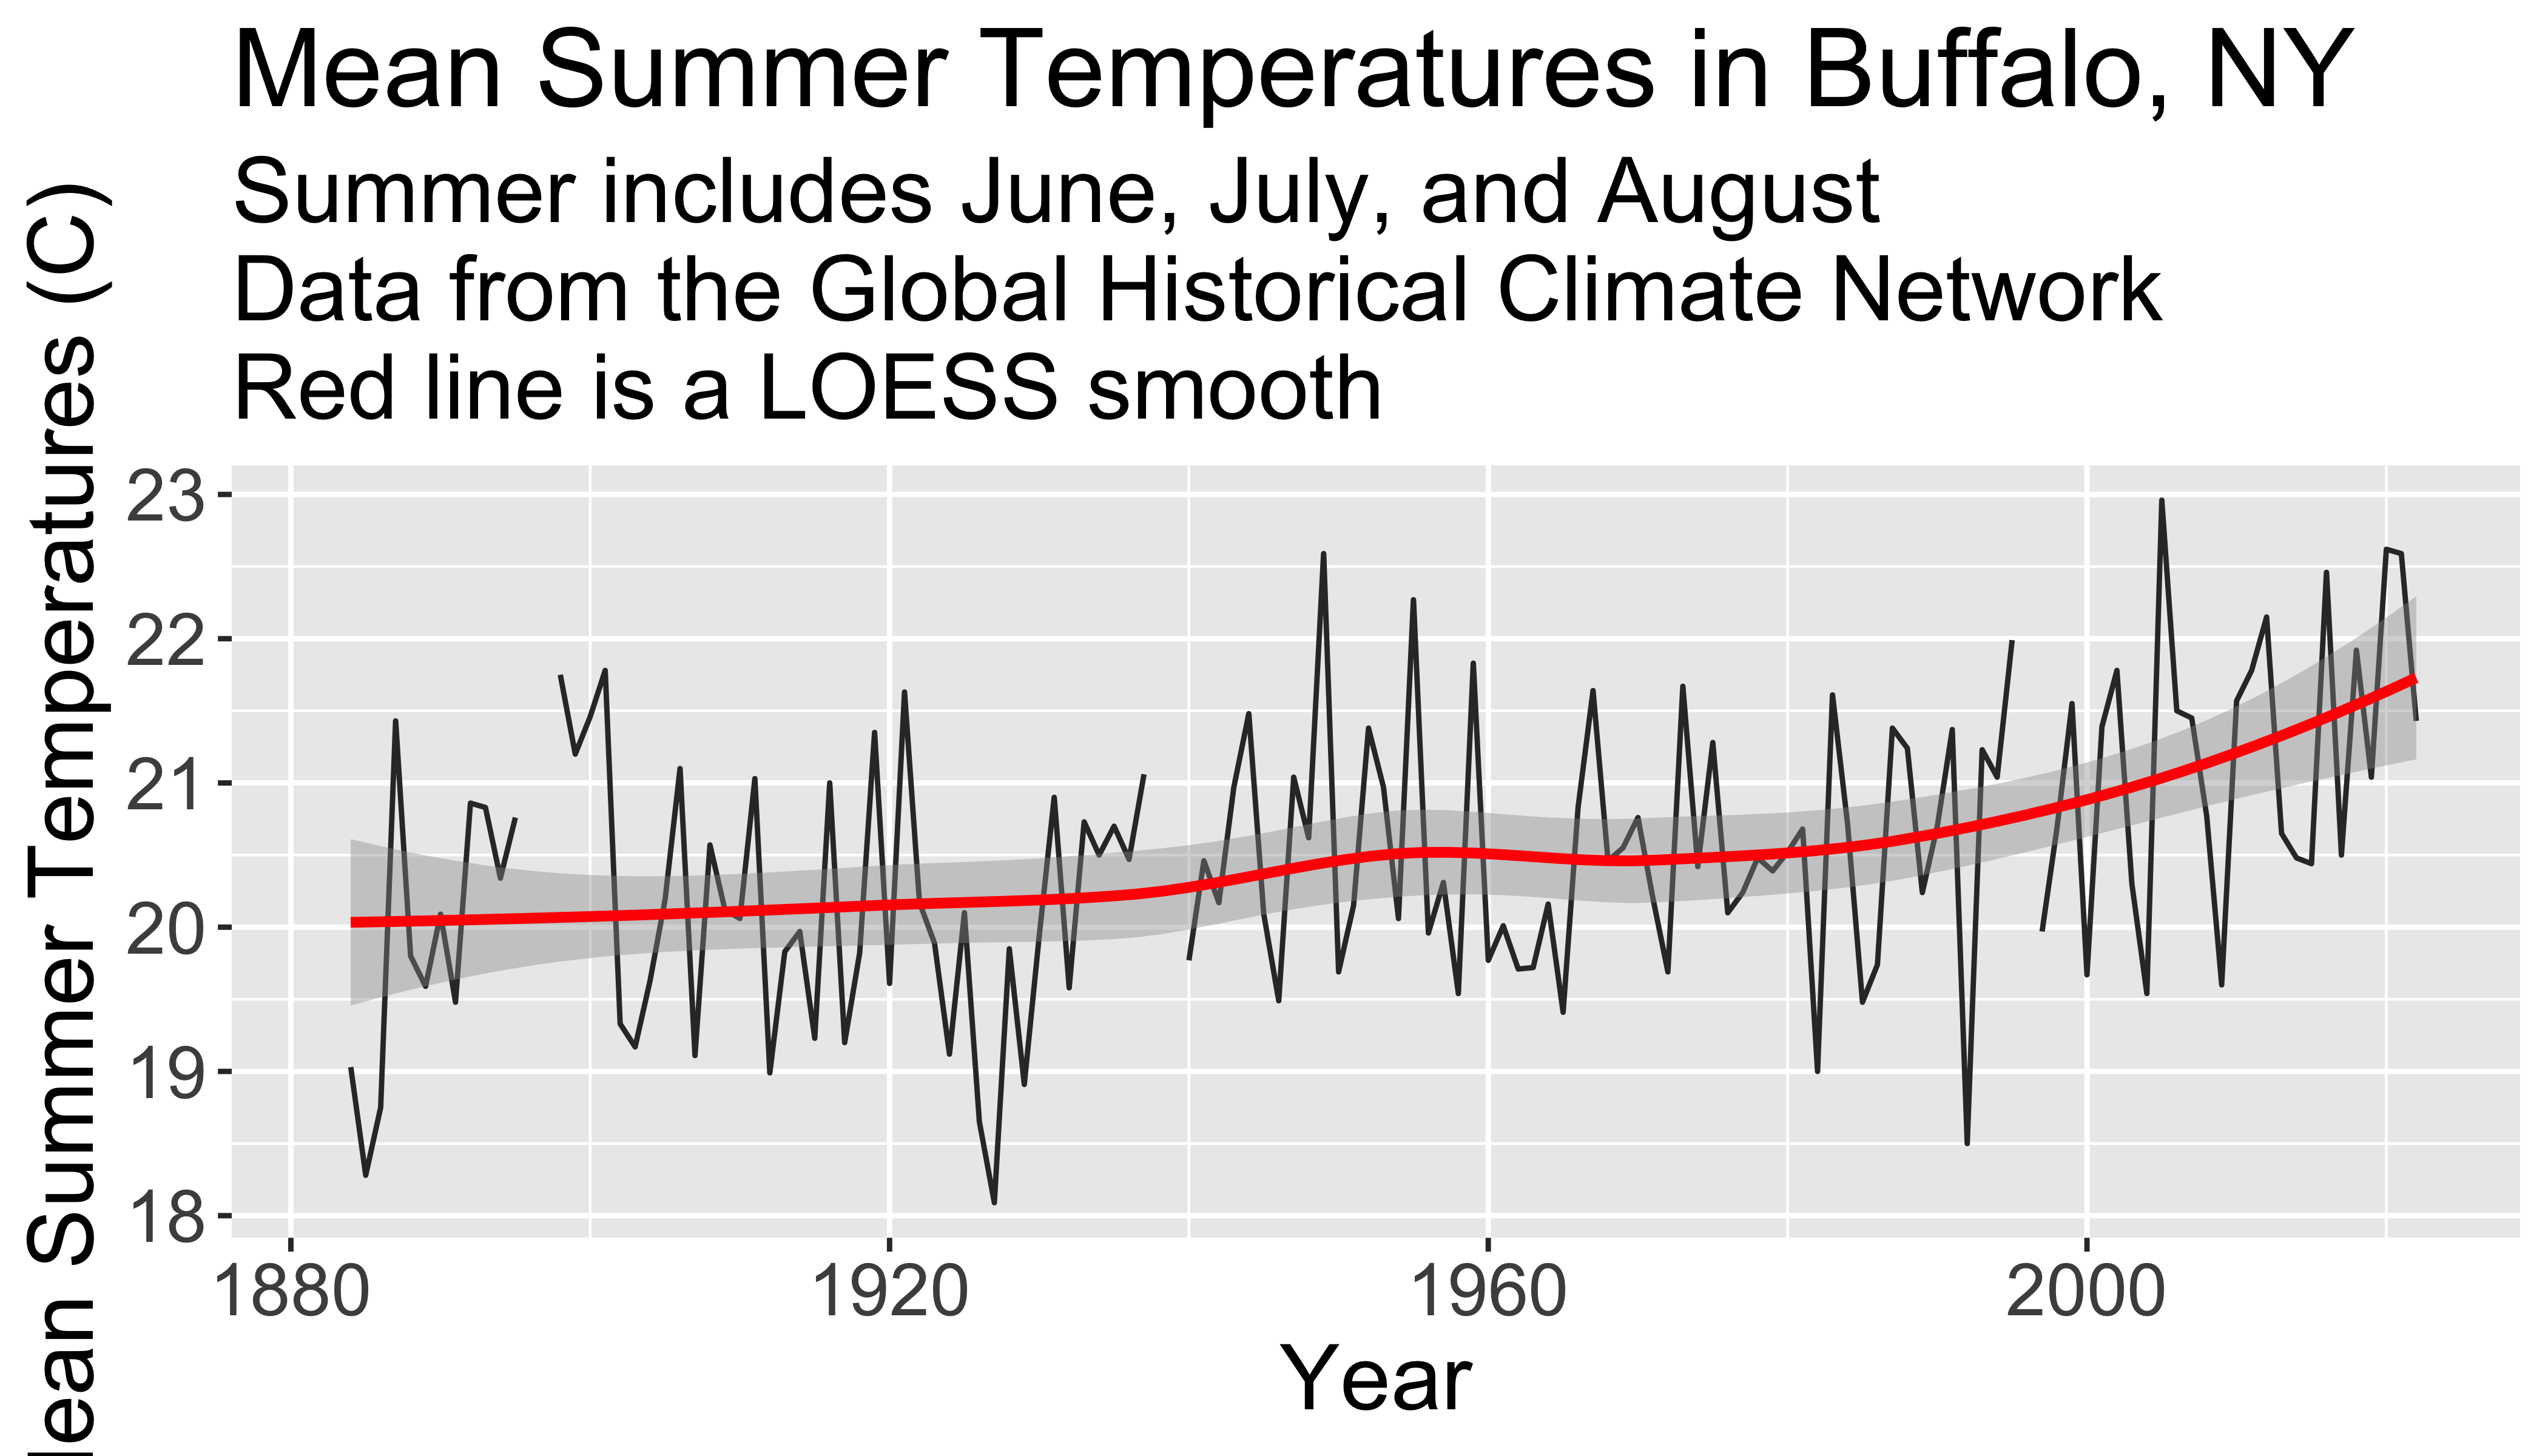
You want to make a nice graphic to show your grandfather at your next family gathering. Be sure to include informative axis labels, a graph title, a graph subtitle describing the source of the data, the raw data, and a smoothed line showing the overall trend through time.
It should look something like this:
Specific Tasks
- Create a new R script in RStudio
- Load data from a comma-separated-values formatted text file hosted on a website
- Graph the annual mean temperature in June, July and August
(
JJA) using ggplot - Add a smooth line with
geom_smooth() - Add informative axis labels using
xlab()andylab()including units - Add a graph title with
ggtitle() - Save a graphic to a png file using
png()anddev.off()ORggsave - Save the script
- Click ‘Source’ in RStudio to run the script from beginning to end to re-run the entire process
What do you tell your grandfather and his brother? What additional tests / visualizations could you do?
Extra time?
If you have extra time, use the station selector to find the links to download additional stations and make additional plots. You could even merge different stations into the same table and plot them together.
Can you think of other plots to consider? Perhaps aggregating to mean temperature by decade?